Clinical
Gauging success in myopia management
In this article:
Has your myopia management strategy been a success? Discover how our free-to-download, multi-language Managing Myopia Guidelines Infographics can guide you through determining success in myopia management treatments, and how to manage outcomes.
Originally published: December 23, 2018
Updated: November 21, 2023
How can you tell if your myopia management strategy has been a success? Our popular Myopia Profile Managing Myopia Guidelines infographics (free to download and available in numerous languages) are designed to translate research into practice, and are a world first, evidence based clinical decision making tool. There are four panels of the infographic designed to be a chairside reference for eye care professionals, and another four panels designed to guide in-room discussions between eye care professionals, patients and their parents. The panel below is the fourth of four panels from the chairside reference component, to support eye care professionals in prescribing decisions and long-term myopia management.
The International Myopia Institute (IMI) Clinical Management Guidelines recommends ongoing reviews every six months for young patients undergoing myopia management.1 As described in our article Follow-up schedules for myopia management, at each examination we can ensure that a treatment is suitable for the patient and their family, and is providing ideal outcomes for their vision, eye health and myopia control. While we may wish to gauge success every six months, it is recommended to wait 12 months (provided a treatment is suitable to the patient) to account for seasonal variation in myopia progression (faster progression in winter; slower progression in summer) as well as being able to compare against expected annual progression rates for a child of that age. Because myopia progression may not be linear across a year, this allows for the best judgements of efficacy.2
The Managing Myopia Guidelines Infographics provide guidance on gauging success over 12 months of treatment, based on measured progression in refraction (D) and axial length (mm). Each section is explored below.
Myopia control outcomes based on refraction
Ensure you take the most accurate refraction possible by controlling accommodation, to allow you to make comparisons.1 Accommodation can be controlled with cycloplegia, but if you don't have that available, contralateral eye fogging can improve the accuracy of retinoscopy and subjective refraction to around 0.25D of cycloplegic refraction in non-strabismic children.3,4
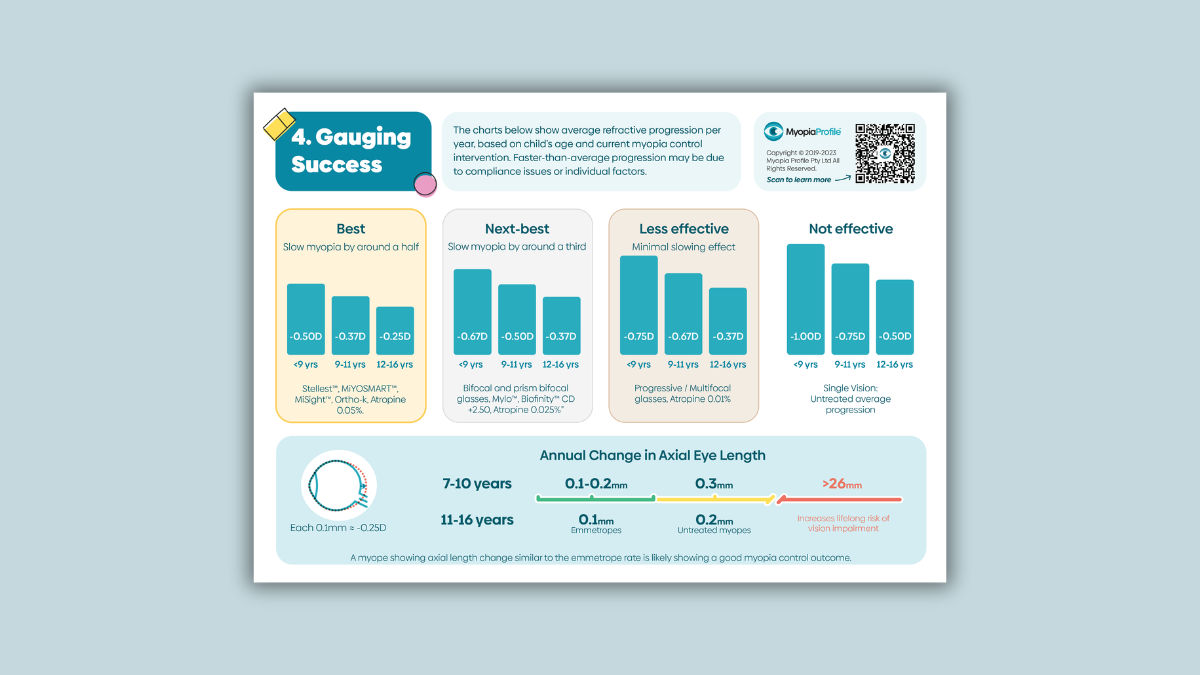
The image below, from the Managing Myopia Guidelines Infographics chairside reference panel entitled Gauging Success, shows average refractive progression per year, based on a child’s age and current myopia control intervention. Compare the child's refractive progression over the past year to what the average amount of progression is in a single vision corrected (untreated) child of the same age. Consider how effective we are expecting their myopia control treatment to be, using the ‘best’ and ‘next best’ categories shown in the Myopia Profile Managing Myopia Guidelines Infographics. For understanding on how treatments fit into these categories, read our article What to prescribe for myopia control.
How can you use this data to determine outcomes?
The 'Not effective' panel on the right provides a useful comparison against what may have been expected had a myopia control treatment not been prescribed. (e.g. single vision correction).5 This can be a useful place to start in clinical communication.
Look at the average expected annual progression, based on age, for that category of treatment. Hopefully you have been able to prescribe one of the ‘best’ available treatments, which have been shown to slow myopia progression by at least half, on average.
If progression is on-par or slower than expected, this is a great result, giving you the confidence to continue the current treatment.
Say this in practice: "Myopia control treatments can slow progression but not promise to stop it. This means that small changes in your child's myopia can still occur with myopia control treatment. The good news today is that the treatment is working and slowing progression by the amount expected / better than the amount expected."
If progression is greater than expected, consider compliance issues, visual environment and other individual factors which could contribute to this result.
Say this in practice: "Your child's myopia progression appears to be a little faster than what we expect for their age, on average. There can be individual reasons for this, which we will explore further." In these cases, learn more about management from our Myopia Profile article Why isn't the myopia management strategy working?
These 'expected' change values are categorized by each treatments reported 'average' efficacy for slowing myopia progression, and do not take individual patient factors into consideration.
Myopia control outcomes based on axial length
While myopia control efficacy in research is gauged by both refractive and axial length measures, most eye care practitioners don’t routinely measure axial length in clinical practice, mainly due to lack of access to the instrumentation. It is becoming more commonplace, though, and there are various ways to use axial length data. The International Myopia Institute Clinical Management Guidelines1 recommends annual axial length measurement, if available, and with a non-contact device (eg. optical biometer) which is much more accurate than A-scan ultrasound techniques.
Take a quick course in axial length measurement and how to use data in our articles Back to basics on axial length measurement and How much axial length growth is normal?
The image below is another section from the Managing Myopia Guidelines Infographics chairside reference panel on Gauging Success, this time providing axial length targets. The data is broken into two age groups, based on published data on axial length growth slowing with age.
Using the absolute change in axial length measured from one year to the next, the growth line in this image shows three coloured zones which denote the following.
Green zone: If axial length measurement is available to you, then the value of 0.1-0.2mm growth per year for a 7-10 year old, and around 0.1mm per year for a 11-16 year old, is a reasonable treatment outcome. Observing eye growth in this range brings the myopic child on par with what would be expected from normal emmetropic eye growth at the same age.6-10
Yellow zone: Untreated myopes typically increase axial eye length by 0.3mm per year for 7-10 year olds and 0.2mm per year for 11-16 year olds.[6-10] Ideally a myopia control treatment should be slowing axial eye growth to less than these amounts. If axial length growth is greater than expected, consider compliance issues, visual environment and other individual factors which could contribute to this result. In these cases, learn more about management from our Myopia Profile article Why isn't the myopia management strategy working?
Red zone: Keeping axial eye length below 26mm dramatically reduces the risk of sight threatening eye disease across a person's lifetime,11 making this the overall goal to achieve from clinical myopia management.
There are other ways to use axial length data, for example in percentile growth charts. There are various axial length measurement instruments which now incorporate growth charts and support tracking and communication on outcomes. Ideally, we would want to see myopes reduce in their percentile as an indicator of successful treatment, which better indicates a specific result to that individual than comparison to averages. Learn more in our article How to use axial length growth charts.
Axial length as a single measure can be indicative of ocular health risk due to myopia, where 26mm appears the delineator where risk significantly escalates. Axial length as a repeated measure can gauge myopia control success.
Projecting progression or analysing it later?
The Managing Myopia Guidelines Infographic allows you to address myopia progression as it occurs and set reasonable expectations for treatment.
A comparison is the BHVI Myopia Calculator, which projects progression from a minimum of age 6 up to age 17, and provides a long term illustration of treatments. This is very useful to demonstrate the concept of myopia progression to parents, at the initiation of treatment. When it comes to treatment efficacy, it does provide confidence intervals to allow for individual variation, but it is problematic projecting an average percentage efficacy over potentially a decade of childhood, when most studies are 2-3 years in duration.
It makes more clinical sense to firstly prepare parents on their expectations of efficacy and then to address myopia progression as and when it occurs. The important message is that for younger children, a 50% efficacy means much more in absolute terms, when they are likely to progress more quickly, than for older children. If your 8 year old patient progresses -0.50D in a year, this likely constitutes a 50% myopia control effect (a good outcome), in comparison to the meta-analysis average.5 If your 12 year old patient progresses -0.50D in a year, though, this shows minimal efficacy and a new management strategy may be required. The Managing Myopia Guidelines Infographic means you don’t need to do these calculations in your head, and have at-hand support in explaining these outcomes to parents.
An extremely useful article on MyKidsVision.org for parents is Understanding expectations in myopia control. In the Myopia Profile Resource Centre, you can download and print the My Kids Vision QR code sheet, which connects parents with specific information based on your discussions, including this key article.
How we describe myopia control efficacy is still under debate by scientists - is it best described as an absolute2 or proportional12 effect? More on that to come. Until we learn more, though, describing efficacy in view of measured, annualised refractive progression in your individual patient provides a short-term evidence based approach, which is simple to apply in practice, and provides ability to categorize treatments to facilitate selection and gauge success.
The Managing Myopia Guidelines Infographics
Myopia Profile’s popular and entirely free Managing Myopia Guidelines Infographics are designed to support clinical communication and decision making in myopia management. These engaging infographics are available to download and print in several formats and numerous language translations.
There are two four-panel infographics which can be printed in large format as poster (ANSI-C or A2), or scaled down to US Letter or A4 to be used as a handheld infographic for in-room discussions and reference.
The mostly blue infographic is a chairside reference guide for eye care professionals that guides you through: (1) Myopia risk factors, (2) What to prescribe, (3) Follow-up schedules and (4) Gauging success
The multi-colored infographic is designed to help you communicate with parents and patients on the following topics : (1) Visual environment advice, (2) What are my options? (3) Kids can wear contact lenses and (4) Why myopia management is essential.
The Infographics can also be printed as individual panels (US Letter and A4 sizes) to use each page on its own if you prefer. As above, there are four which are parent- and patient-facing (multi-coloured) and four which are your chairside reference (mostly blue coloured). The image below shows various print formats, with all panels collated (at back) and single pages (foreground).
Freshly updated in late 2023 and built from the ground up from continued feedback with eye care practitioners and industry advisers, these Managing Myopia Guidelines Infographics are designed to be used by eye care professionals, in discussion with patients and their carers, and as a clinical reference.
For an overview of how to use the Infographics in practice, read our article Using the Managing Myopia Guidelines Infographics
For guidance on the guided clinical communication process provided the Infographics, read our article Keys to Communication in Myopia Management.
Once you have used the Infographics to explain myopia to patients and their parents or carers in your exam room, these messages can be further enhanced by providing the take-home, free-to-download Managing Myopia patient brochure.
Meet the Authors:
About Kate Gifford
Dr Kate Gifford is an internationally renowned clinician-scientist optometrist and peer educator, and a Visiting Research Fellow at Queensland University of Technology, Brisbane, Australia. She holds a PhD in contact lens optics in myopia, four professional fellowships, over 100 peer reviewed and professional publications, and has presented almost 300 conference lectures around the world. Kate is the Chair of the Clinical Management Guidelines Committee of the International Myopia Institute. In 2016 Kate co-founded Myopia Profile with Dr Paul Gifford; the world-leading educational platform on childhood myopia management. After 13 years of clinical practice ownership, Kate now works full time on Myopia Profile.
References
Gifford KL, Richdale K, Kang P, Aller TA, Lam CS, Liu YM, Michaud L, Mulder J, Orr JB, Rose KA, Saunders KJ, Seidel D, Tideman JWL, Sankaridurg P. IMI - Clinical Management Guidelines Report. Invest Ophthalmol Vis Sci. 2019 Feb 28;60(3):M184-M203. (link)
Brennan NA, Toubouti YM, Cheng X, Bullimore MA. Efficacy in myopia control. Prog Retin Eye Res. 2021 Jul;83:100923. (link)
Yeotikar NS, Bakaraju RC, Roopa Reddy PS, Prasad K.(2007) Cycloplegic refraction and non-cycloplegic refraction using contralateral fogging: a comparative study, Journal of Modern Optics, 54:9, 1317-1324 (2007). (link)
Chiu NN, Rosenfield M, Wong LC. Effect of contralateral fog during refractive error assessment. J Am Optom Assoc. 68(5):305-8 (1997). (link)
Donovan L, Sankaridurg P, Ho A, Naduvilath T, Smith EL 3rd, Holden BA. Myopia progression rates in urban children wearing single-vision spectacles. Optom Vis Sci. 2012 Jan;89(1):27-32. (link)
Hou W, Norton TT, Hyman L, Gwiazda J; COMET Group. Axial Elongation in Myopic Children and its Association With Myopia Progression in the Correction of Myopia Evaluation Trial. Eye Contact Lens. 2018 Jul;44(4):248-259. (link)
Mutti DO, Hayes JR, Mitchell GL, Jones LA, Moeschberger ML, Cotter SA, Kleinstein RN, Manny RE, Twelker JD, Zadnik K; CLEERE Study Group. Refractive error, axial length, and relative peripheral refractive error before and after the onset of myopia. Invest Ophthalmol Vis Sci. 2007 Jun;48(6):2510-9. (link)
Fledelius HC, Christensen AS, Fledelius C. Juvenile eye growth, when completed? An evaluation based on IOL-Master axial length data, cross-sectional and longitudinal. Acta Ophthalmol. 2014. (link)
Rozema J, Dankert S, Iribarren R, Lanca C, Saw S-M. Axial Growth and Lens Power Loss at Myopia Onset in Singaporean Children. Invest Ophthalmol Vis Sci. 2019;60(8):3091-3099. (link)
Tideman JWL, Polling JR, Vingerling JR, Jaddoe VWV, Williams C, Guggenheim JA, Klaver CCW. Axial length growth and the risk of developing myopia in European children. Acta Ophthalmol. 2018. (link)
Tideman JW, Snabel MC, Tedja MS, van Rijn GA, Wong KT, Kuijpers RW, Vingerling JR, Hofman A, Buitendijk GH, Keunen JE, Boon CJ, Geerards AJ, Luyten GP, Verhoeven VJ, Klaver CC. Association of Axial Length With Risk of Uncorrectable Visual Impairment for Europeans With Myopia. JAMA Ophthalmol. 2016 Dec 1;134(12):1355-1363. (link)
Chamberlain P, Bradley A, Arumugam B, Hammond D, McNally J, Logan NS, Jones D, Ngo C, Peixoto-de-Matos SC, Hunt C, Young G. Long-term Effect of Dual-focus Contact Lenses on Myopia Progression in Children: A 6-year Multicenter Clinical Trial. Optom Vis Sci. 2022 Mar 1;99(3):204-212. (link)
Enormous thanks to our visionary sponsors
Myopia Profile’s growth into a world leading platform has been made possible through the support of our visionary sponsors, who share our mission to improve children’s vision care worldwide. Click on their logos to learn about how these companies are innovating and developing resources with us to support you in managing your patients with myopia.

