Science
Johnson & Johnson MedTech ARVO 2024 Showcase
Sponsored by
In this article:
The 2024 meeting of The Association for Research in Vision and Ophthalmology (ARVO) was held from May 5 – 9 and gathered international researchers to share their recent research and findings. Johnson & Johnson Medtech highlighted their work with four presentations on Abiliti™ 1-day soft contact lenses, myopia prevalence and myopia control efficacy prediction at the conference.
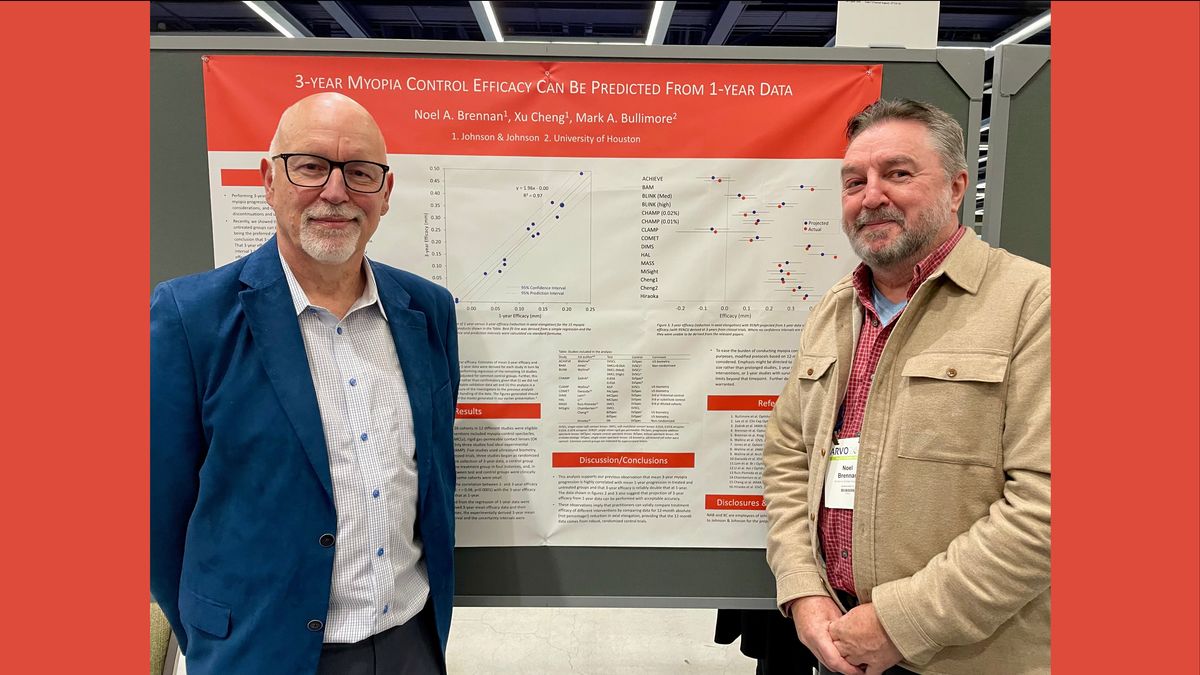
The image above shows lead authors on their latest research, from left: Mark Bullimore and Noel Brennan.
- Assessment of off-eye power profile for a non-coaxial multi-zone soft contact lens via deflectometry and ray tracing methods
- Subjective Vision Performance of Soft Contact Lenses for Myopia Control in Children
- 3-year myopia control efficacy can be predicted from 1-year data: a meta-analysis
- Increased prevalence of myopia in the United States between 1971-1972 and 1999-2004—a reappraisal and model
Assessment of off-eye power profile for a non-coaxial multi-zone soft contact lens via deflectometry and ray tracing methods
Authors: Augustine N. Nti1, Alex Nixon1, Todd Szarlan1, Derek Nankivil1, Jaclyn Hernandez1, Xu Cheng1, Noel A. Brennan1
- Johnson and Johnson MedTech, Jacksonville, Florida, United States
Summary
Myopia controlling soft contact lenses incorporate multiple zones of power as their mechanism of slowing myopia progression: these can be in a co-axial (zones are aligned to the visual axis) or non-coaxial (zones are not aligned to the visual axis) designs. The Abiliti™ 1-Day contact lens is a non-coaxial design which aims to improve myopia controlling efficacy by increasing relative plus power in the lens profile while maintaining vision quality, which can be compromised in coaxial designs with higher add powers.1,2 This study assessed the NIMO TR1504 optical lens analyser’s ability to measure the optical profile of the Abiliti™ 1-Day contact lens. They found that the radial and tangential power profiles measured by NIMO TR1504 underestimated the add power in both central and annular zones of the Abiliti™ 1-Day contact lens, compared to ray tracing calculations. The tangential power profiles also erroneously showed sharp drops in power at the zone margins. The findings provide insight in the capabilities and limitations of the NIMO TR1504 in profiling complex optical designs and highlight the need for the development of advanced measurement technologies, as existing commercial tools may not be sufficient for accurate assessment and comparison of contact lens designs for myopia.
Clinical take-home message: For accurately quantifying the power profiles of non-coaxial myopia control contact lenses, ray tracing calculations are more reliable than current optical lens analysers.
Abstract
Purpose: Non-coaxial, multizone optical designs have been incorporated into soft contact lenses for myopia control to disrupt the inverse relationship between efficacy and vision quality seen with coaxial designs. Commercial optical lens analyzers are available to measure power profiles of contact lenses, but limitations have been identified in their application to multizone designs (Kim et al. JOptom 2016;9:126). This study evaluated the capability of the NIMO TR1504 (Lambda X, Belgium) in assessing the optics of a commercially available soft contact lens for myopia control (ACUVUE® Abiliti™ 1-Day, Johnson & Johnson MedTech, Jacksonville, FL).
Methods: Radial and tangential power profiles of the lenses were measured with the NIMO TR1504. Five lenses of each power from -1D to -5D in 1D steps were stored in buffered saline solution for at least 12h at 20°C, then measured in a wet cell and converted to equivalent power in air. Add power was calculated as the difference between the minimum power in the first distance zone and the maximum power for each treatment zone. Add powers for the -3D lens were also calculated using ray tracing simulation by manual optimization of the geometric spot size in Zemax (Ansys, Canonsburg, PA).
Results: The add power was averaged across all labelled distance powers. Both power profiles showed a small central high plus zone, surrounded by alternating annular distance and treatment zones. The add power (mean ± SD) of the radial power profiles were lower (5.56D ± 0.33D centrally, 1.52D ± 0.09D and 0.73D ± 0.29D for first and second treatment zones) than the tangential profiles (9.43D ± 0.52D centrally, 6.00D ± 0.24D and 6.00D ± 0.88D for first and second treatment zones), and both were lower than add powers from ray tracing calculations of the -3D lens (+10.34D centrally, +6.92D and +6.83D in the first and second treatment zones). The tangential power profiles showed artificial sharp drops in lens power at the zone margins.
Conclusions: The NIMO TR1504 failed to accurately render the lens design, underestimating power in both central and annular zones. This reinforces previously documented challenges of optical lens analyzers in the optical characterization of small central or non-coaxial zones. Proprietary, custom equipment and software are needed to accurately represent the optics of more complex designs such as Abiliti™ 1-Day.
Subjective Vision Performance of Soft Contact Lenses for Myopia Control in Children
Authors: Alex Nixon1, Jie Xu1, Robert Morlock2, Noel A. Brennan1, Xu Cheng1
- Johnson and Johnson MedTech, Jacksonville, Florida, United States
- YourCareChoice, Michigan, United States
Summary
Conventional multifocal and dual focus lenses used for managing myopia demonstrate a compromise between the quality of vision they provide and their effectiveness in controlling myopia.2,3 This study evaluated the subjective vision performance of three myopia controlling soft contact lenses: two prototypes with non-coaxial ring-focus design (designed for enhancing efficacy [EE] or enhancing vision [EV] compared to a dual focus design), and a commercially available dual-focus [DF] design. Children (n = 75) aged 7 – 17 years old wore each of the lenses for 2 weeks. A qualitative vision questionnaire, and logMAR visual acuity were measured. The EE and the DF lenses showed similar performance in terms of subjective vision quality. The EV lens showed a higher proportion of favourable responses from the questionnaire, indicating better subjective performance, approaching the performance of single vision contact lenses. While differences between the lens types for logMAR visual acuity were minimal under photopic conditions (around 2 letters in logMAR equivalent), they became more pronounced in mesopic conditions (up to 4.5 letters difference).
Clinical take-home message: This study adds valuable insights into how new contact lens designs for myopia control perform in real-world conditions alongside a commercially available myopia control lens design.
Abstract
Purpose: Conventional multifocal and dual focus designs for myopia control exhibit a trade-off between vision quality and myopia control efficacy. Cheng et al reported myopia control efficacy data from two soft contact lens prototypes developed to either enhance efficacy for myopia control or to enhance vision compared to a dual focus lens, concluding both lenses met their design intent. This study assesses the subjective vision performance of the prototype soft contact lenses alongside a commercially available dual focus lens in a pediatric population.
Methods: This was a multi-site, single-masked, 3x3 crossover study with a run-in period. Healthy myopic children from 7 and 17 years old were recruited. All subjects first completed a one-week run-in phase with a single use soft contact lens with conventional optics. Subjects were then fit with one of three myopia control soft contact lenses (MC SCLs) in a randomized order for each of three, 2-week periods. The study lenses included two senofilcon A prototypes with noncoaxial ring-focus designs (for enhancing efficacy [EE] and enhancing vision [EV]) and a commercially available omafilcon A dual-focus (DF) design. The Pediatric Myopia Control Contact Lens questionnaire, a qualitatively valid PRO measure, and logMAR visual acuity assessments were completed after two weeks of wear.
Results: The intent-to-treat population included 75 participants, with 38 from 7-12 years (mean 10.6 ± 1.05 years) and 37 from 13-17 years (mean 14.7 ± 1.31 years). The proportion of best two box responses differed by lens type and vision construct, but rank order patterns were largely consistent. The EE and DF lenses approximated one another for vision, with EV showing a pattern for higher proportion of T2B responses. All lenses measured within 0.04 logMAR of one another for binocular photopic high contrast acuity 4 meters, with the difference increasing to 0.09 logMAR under mesopic conditions.
Conclusions: The senofilcon A EE lens showed similar subjective vision performance to the commercially available DF design. The senofilcon A EV lens showed a pattern for a higher proportion of top best box responses than EE and DF, approaching the conventional optics lens. Differentiation by lens type was limited with photopic high contrast conditions, but more readily apparent through subjective assessment, mesopic conditions, or low contrast optotypes.
3-year myopia control efficacy can be predicted from 1-year data: a meta-analysis
Authors: Noel A. Brennan1, Xu Cheng1, Mark A. Bullimore2
- R&D, Johnson and Johnson Medtech, Jacksonville, Florida, United States
- College of Optometry, University of Houston, Houston, Texas, United States
Summary
This study explores the potential of one-year efficacy data of myopia control treatments to predict three-year outcomes, an approach driven by the challenges of conducting 3-year trials (ethics, discontinuations, compliance etc). Studies of myopia progression were systematically reviewed, with a focus on axial elongation data over one and three years. The analysis included 15 datasets from 26 cohorts across 12 studies involving interventions such as spectacles, contact lenses, orthokeratology, and low-dose atropine. Using regression analysis, axial elongation over three years was predicted based on measurements from the first year alone. Despite varying study quality, such as non-randomized trials and shared control groups, the correlation between one-year and three-year efficacy was remarkably high (r = 0.98, p ⋘ 0.01), indicating that initial short-term results could reliably forecast longer-term effects where three-year efficacy was around double the one-year efficacy result (see Figure 1).
Figure 1: Plot of 1-year versus 3-year efficacy (reduction in axial elongation) for the 15 myopia control test products shown in the Table. Best fit line was derived from a simple regression and the 95% confidence and prediction intervals were calculated via standard formulae.
Clinical take-home message: This builds on findings by the same authors that three-year progression was also around double the one-year myopia progression: not triple, owing to the natural slowing of progression with age. This understanding of myopia progression and efficacy, and their parallels, suggests validity in demonstrating treatment efficacy and making comparisons between treatments using 12-month data.
Abstract
Purpose: Performing 3-year trials of treatments to slow myopia progression is burdensome, has potential ethical considerations and may suffer from contamination due to discontinuations and use of off-protocol treatments. Recently, we showed that 3-year myopia progression in treated and untreated groups can be predicted from 1-year progression data, with axial elongation being the preferred metric to make this prediction.1 Here, we test the hypothesis that 1-year efficacy of a myopia control treatment can enable projection of 3-year efficacy.
Method: We systematically reviewed the literature to identify papers on myopia progression in children that contained 1-year and 3-year axial elongation for both test and control groups (Pubmed, Embase, OVID and Cochrane Register of Controlled Trials). Eligible studies were appraised for risk of bias. Three-year axial elongation was regressed against 1-year elongation. In accordance with our observation from our earlier study, no covariates were included in the modelling.
Results: A total of 14 data sets from 24 cohorts in 10 different studies were included in the analysis. Test conditions included myopia-control spectacles, contact lenses, orthokeratology and 0.01 and 0.02% atropine. The quality of the data was generally low— only three studies had robust experimental methods and outcomes. Five studies used ultrasound biometry, two studies were non-randomized trials, two studies began as randomized trials but were modified before collection of 3-year data, a control group was common to more than one treatment group in four instances and, in two cases, the differences between test and control groups were clinically insignificant. Given this lack of quality, the correlation between 1- and 3-year efficacy was remarkably high (see figure: r = 0.98, p⋘0.01) with the 3-year efficacy being approximately double that at 1-year.
Conclusion: This analysis builds on our previous observation that group mean 3-year myopia progression is highly correlated with mean 1-year progression. Of course, the observation cannot be applied to individual data. Our findings suggest that valid comparison between different treatment modalities can be made on the basis of 12-month results. This has implications for myopia management in clinical practice and regulatory considerations of myopia control interventions.
This study refers to previously presented research, 'Prediction of 3-year Myopia Progression from 1-year Data,' that was showcased at the American Academy of Optometry (AAO) conference in 2023. You can read our summary of it here.
Increased prevalence of myopia in the United States between 1971-1972 and 1999-2004—a reappraisal and model
Authors: Mark A. Bullimore1, Noel A. Brennan2
- College of Optometry, University of Houston, Houston, Texas, United States
- Johnson & Johnson MedTech Care Inc, Jacksonville, Florida, United States
Summary
This study reevaluates the rising prevalence of myopia in the U.S. population, documented in the National Health and Nutrition Examination Survey (NHANES) data from 1971-1972 and 1999-2004, which increased from 25% to 42% overall, and potentially indicated significant amount of adult-onset myopia.4 Different analysis models were explored in an effort to explain the age-related changes in prevalence between the two survey dates, presuming changes in myopia prevalence over time as well as different rates of adult myopia onset. The findings indicate that the best explanation for increase in US myopia prevalence over 30 years involves a 13.0% increase in overall myopia prevalence and a 17.1% increase due to adult-onset myopia.
Clinical take-home message: This highlights the importance of detection and management of adult-onset myopia, as this appears to be a significant component of overall myopia prevalence in adults, which is not attributable to paediatric myopia progression alone.
Abstract
PURPOSE: Prevalence of myopia in the United States population was estimated to increase from 25% to 42% over the thirty years between the 1971-1972 and 1999-2004 National Health and Nutrition Examination Survey (NHANES).4 However, there were unexplained anomalies in the data set whereby, for example, those aged 18-24 years in 1971-1972 had a myopia prevalence of 28% which increased to 45% among those aged 45-54 years in 1999-2004, suggesting a component of adult myopia onset. Here, we reappraise these data and propose a model to account for the thirty-year changes.
METHOD: We modelled prevalence of myopia by age and time, allowing for both increased prevalence and adult myopia progression between surveys. By way of illustration, frame A of the figure assumes a starting prevalence of 25% among those aged 18 to 24 years in 1971-1972, with no increased prevalence or adult progression over time. In frame B, an increase of 15% prevalence between surveys is assumed but no adult progression. Frame C shows adult onset of 15% between surveys in the absence of change of prevalence across time. In frame D, both an overall increase of myopia prevalence of 15% and adult onset of 15% are modelled. A simple regression was performed on the data from NHANES to estimate the starting prevalence of the youngest age group in 1971-72, the rate of progression across time and adult progression. A similar process was performed using data for a threshold of –2 D, which models adult progression rather than onset.
RESULTS: The myopia prevalence data are best explained by an increase of 13.0% in overall population prevalence and an increase of 17.1% due to adult-onset myopia (frame E). For a myopia criterion of –2D (not shown), an increase of 8.8% in overall population prevalence for this threshold is estimated with an increase of 13.7% due to adult myopic progression. See figure 2.
Figure 2: Prevalence of myopia. A. No increased prevalent over time or adult-onset myopic. B. A 15% incrase in prevalence, but no adult-onset myopia. C. No increased prevalence over time, 15% adult-onset myopia. D. Both a 15% increase in myopia prevalence and 15% adult-onset myopia. E,. NHANCES myopia prevalence data and model.
CONCLUSION: The differences between the NHANES data from 1971-1972 and 1999-2004 are best explained by, not only an increase in overall population myopia prevalence, but a substantial component of myopic adult onset and progression.
Meet the Authors:

About Jeanne Saw
Jeanne is a clinical optometrist based in Sydney, Australia. She has worked as a research assistant with leading vision scientists, and has a keen interest in myopia control and professional education.
As Manager, Professional Affairs and Partnerships, Jeanne works closely with Dr Kate Gifford in developing content and strategy across Myopia Profile's platforms, and in working with industry partners. Jeanne also writes for the CLINICAL domain of MyopiaProfile.com, and the My Kids Vision website, our public awareness platform.
This content is brought to you thanks to an educational grant from
References
- Bickle K, Walline J. Bifocal lenses in nearsighted kids (BLINK) study. Optom Vis Sci 2013;90:E-abstract 130789.
- Ticak A, Walline JJ, Berntsen DA, Mutti DO, Jones-Jordan LA, Cardenas L, Day E, Dougherty BE; BLINK Study Group. Quality of life after wearing multifocal contact lenses for myopia control for 2 weeks in the BLINK Study. Ophthalmic Physiol Opt. 2023 Nov;43(6):1491-1499.
- Walline JJ, Walker MK, Mutti DO, Jones-Jordan LA, Sinnott LT, Giannoni AG, Bickle KM, Schulle KL, Nixon A, Pierce GE, Berntsen DA; BLINK Study Group. Effect of High Add Power, Medium Add Power, or Single-Vision Contact Lenses on Myopia Progression in Children: The BLINK Randomized Clinical Trial. JAMA. 2020 Aug 11;324(6):571-580.
- Vitale S, Sperduto RD, Ferris FL 3rd. Increased prevalence of myopia in the United States between 1971-1972 and 1999-2004. Arch Ophthalmol. 2009 Dec;127(12):1632-9.
Enormous thanks to our visionary sponsors
Myopia Profile’s growth into a world leading platform has been made possible through the support of our visionary sponsors, who share our mission to improve children’s vision care worldwide. Click on their logos to learn about how these companies are innovating and developing resources with us to support you in managing your patients with myopia.